💚
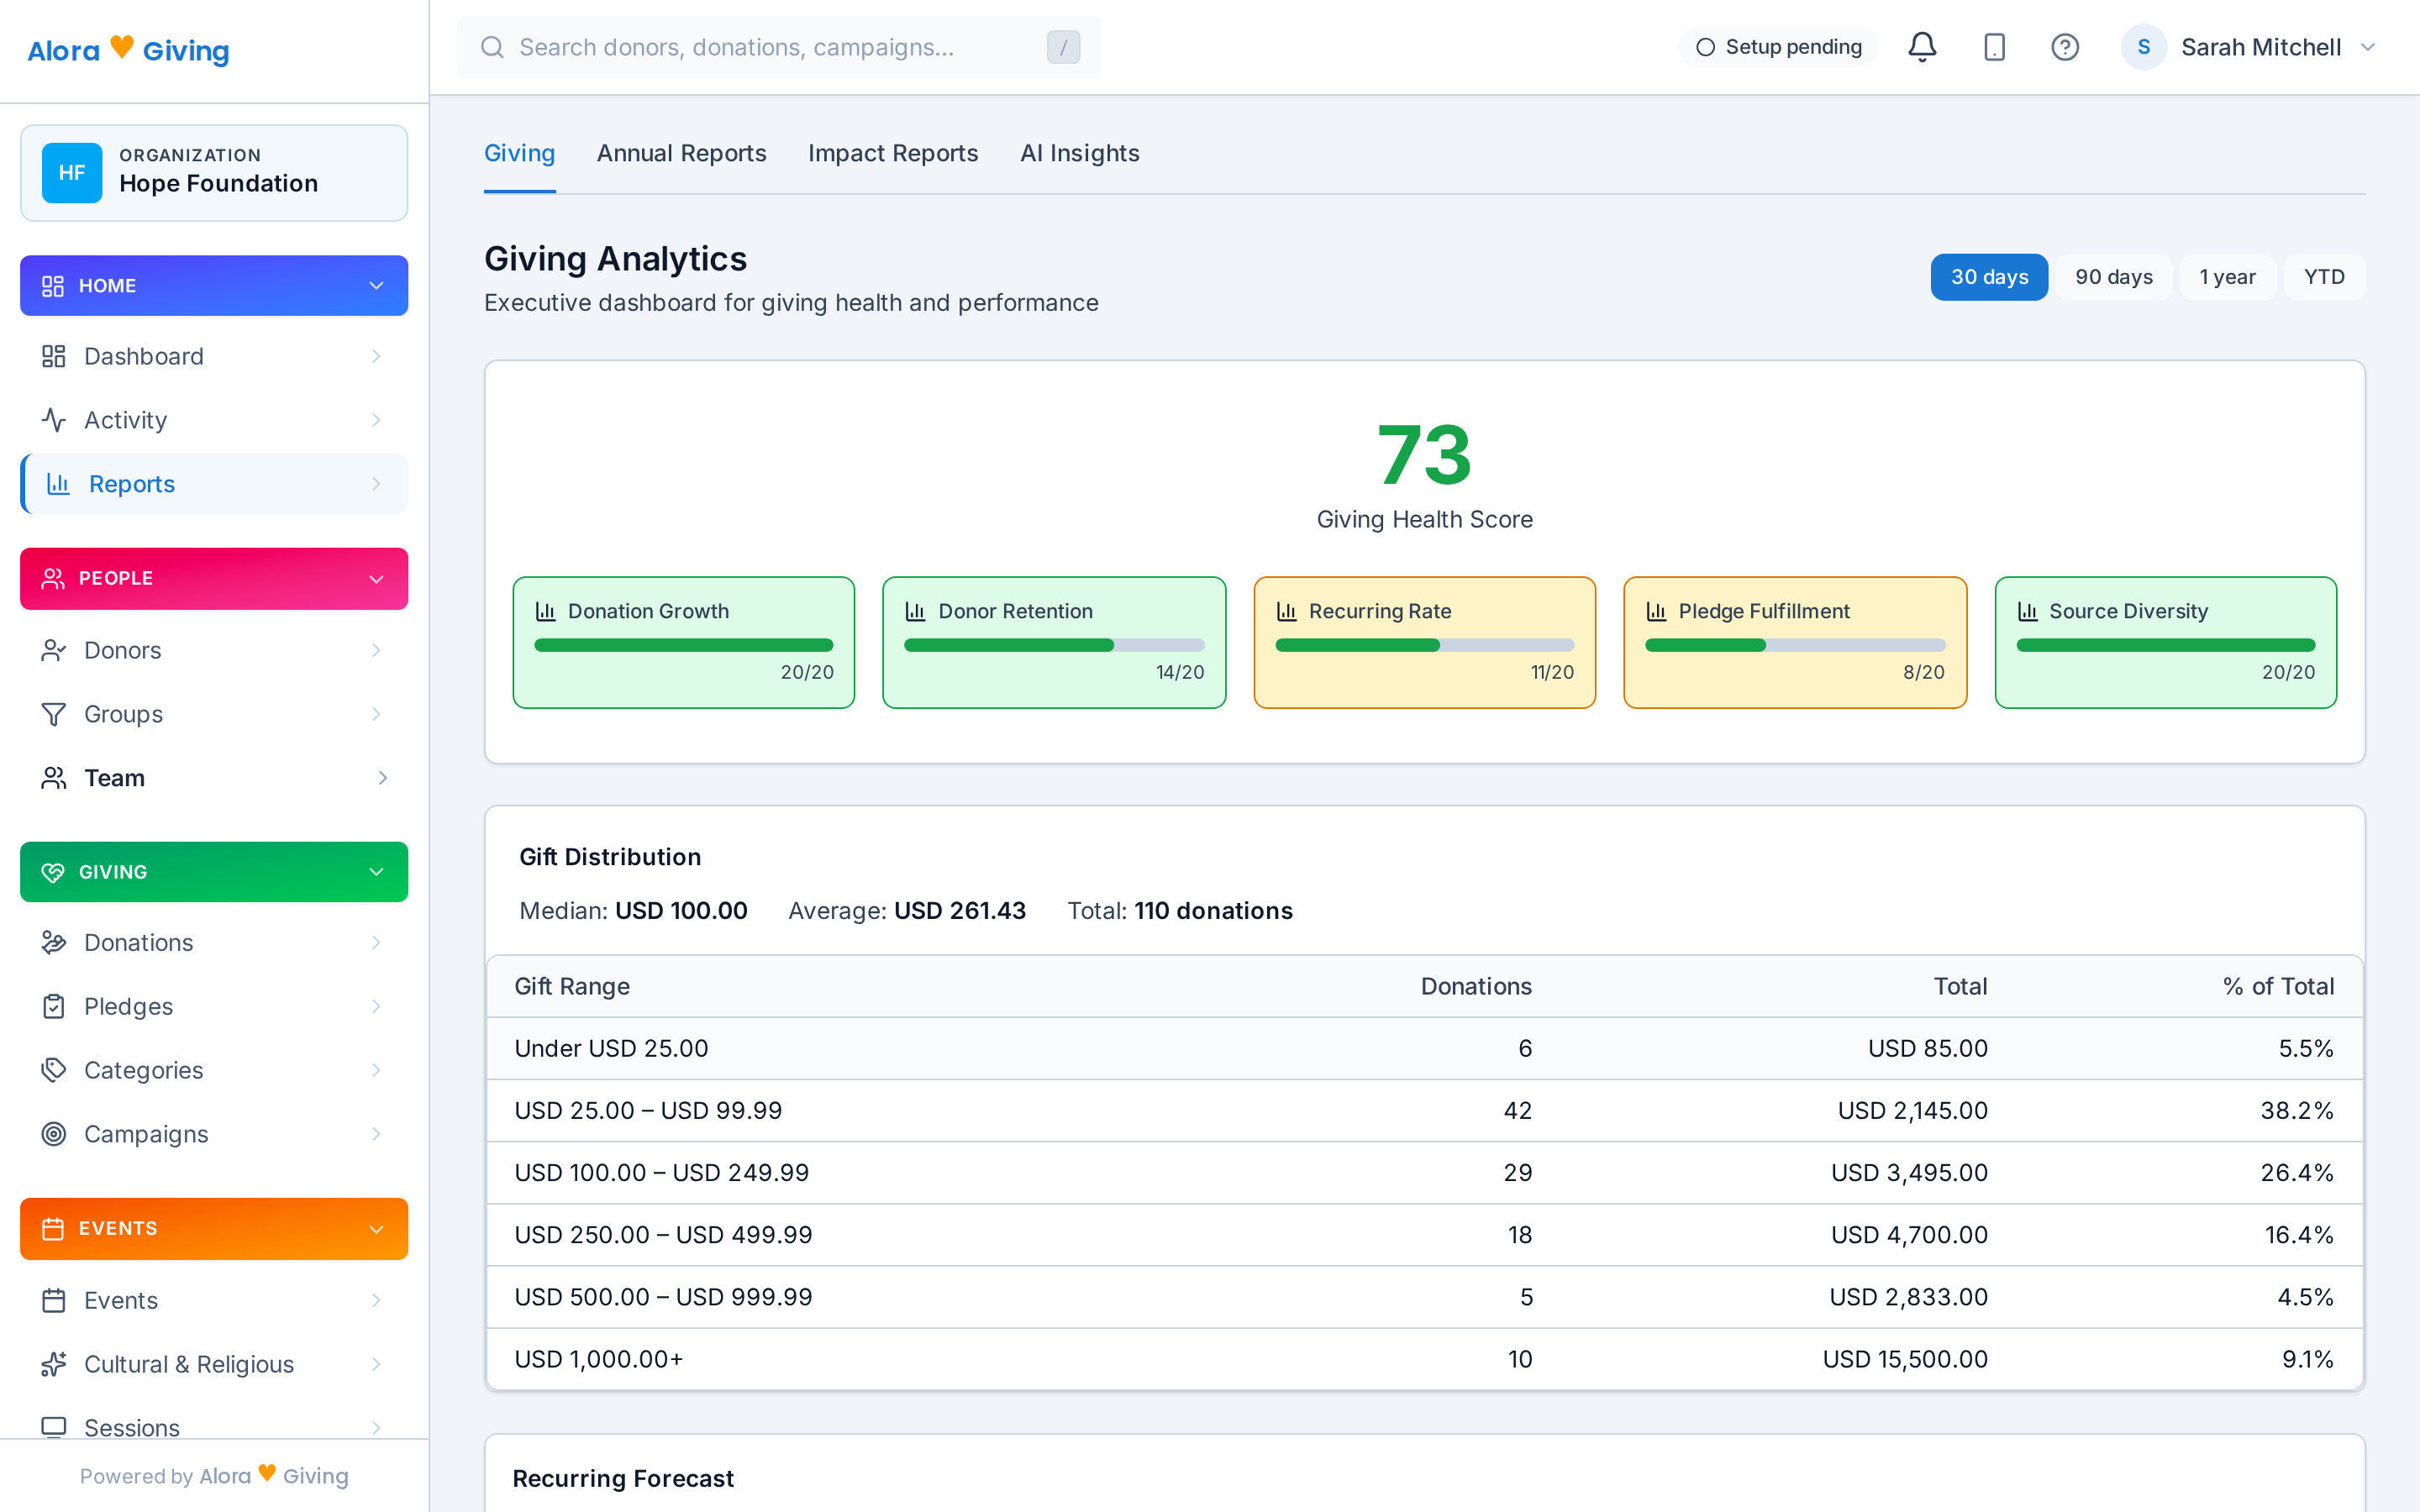
Giving Health Score
One number that tells you how your giving program is really doing — blending retention, recurring share, donor growth, and momentum. Watch it move as your stewardship improves, and see exactly which factor is dragging it down.
📈
Recurring-revenue forecast
Project what your active recurring gifts and pledges will bring in over the coming months — accounting for scheduled renewals, known expirations, and historical retention. Budget on data, not hope.
🚀
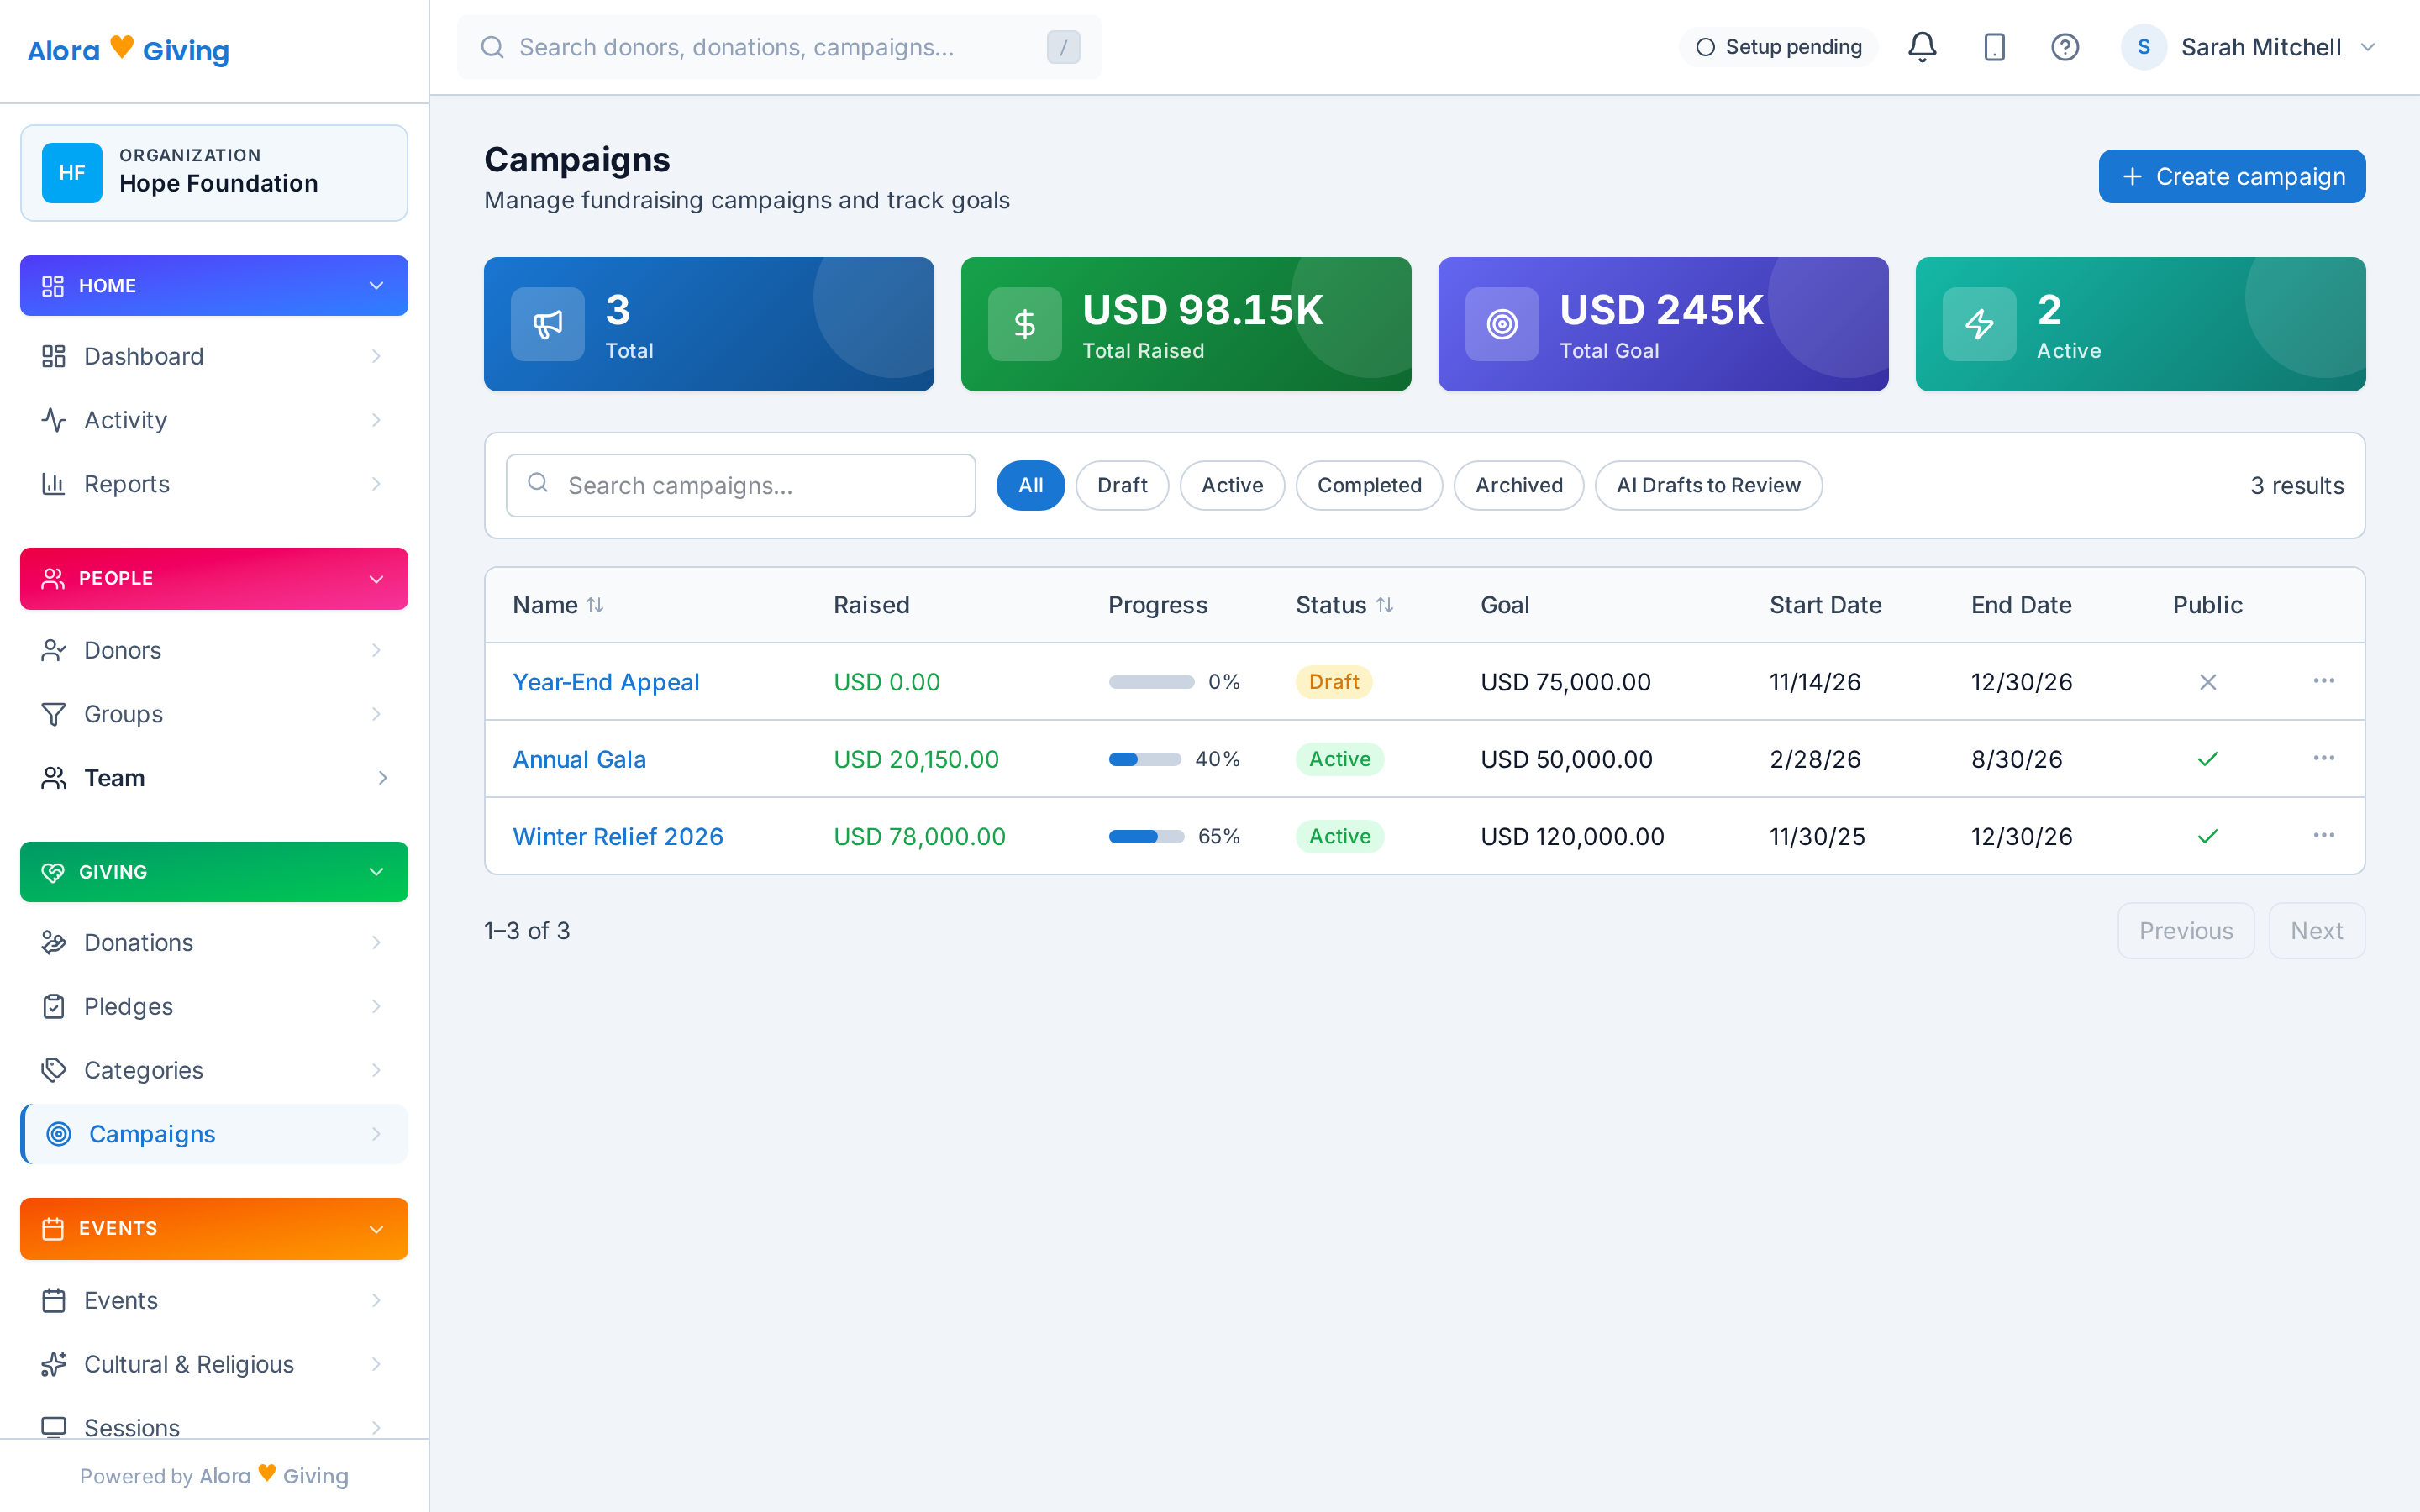
Campaign velocity
Not just "how much so far" — how fast. Velocity tracking shows the giving pace per campaign, whether you're trending toward goal, and when the curve bends, so you can intervene while it still matters.
🔔
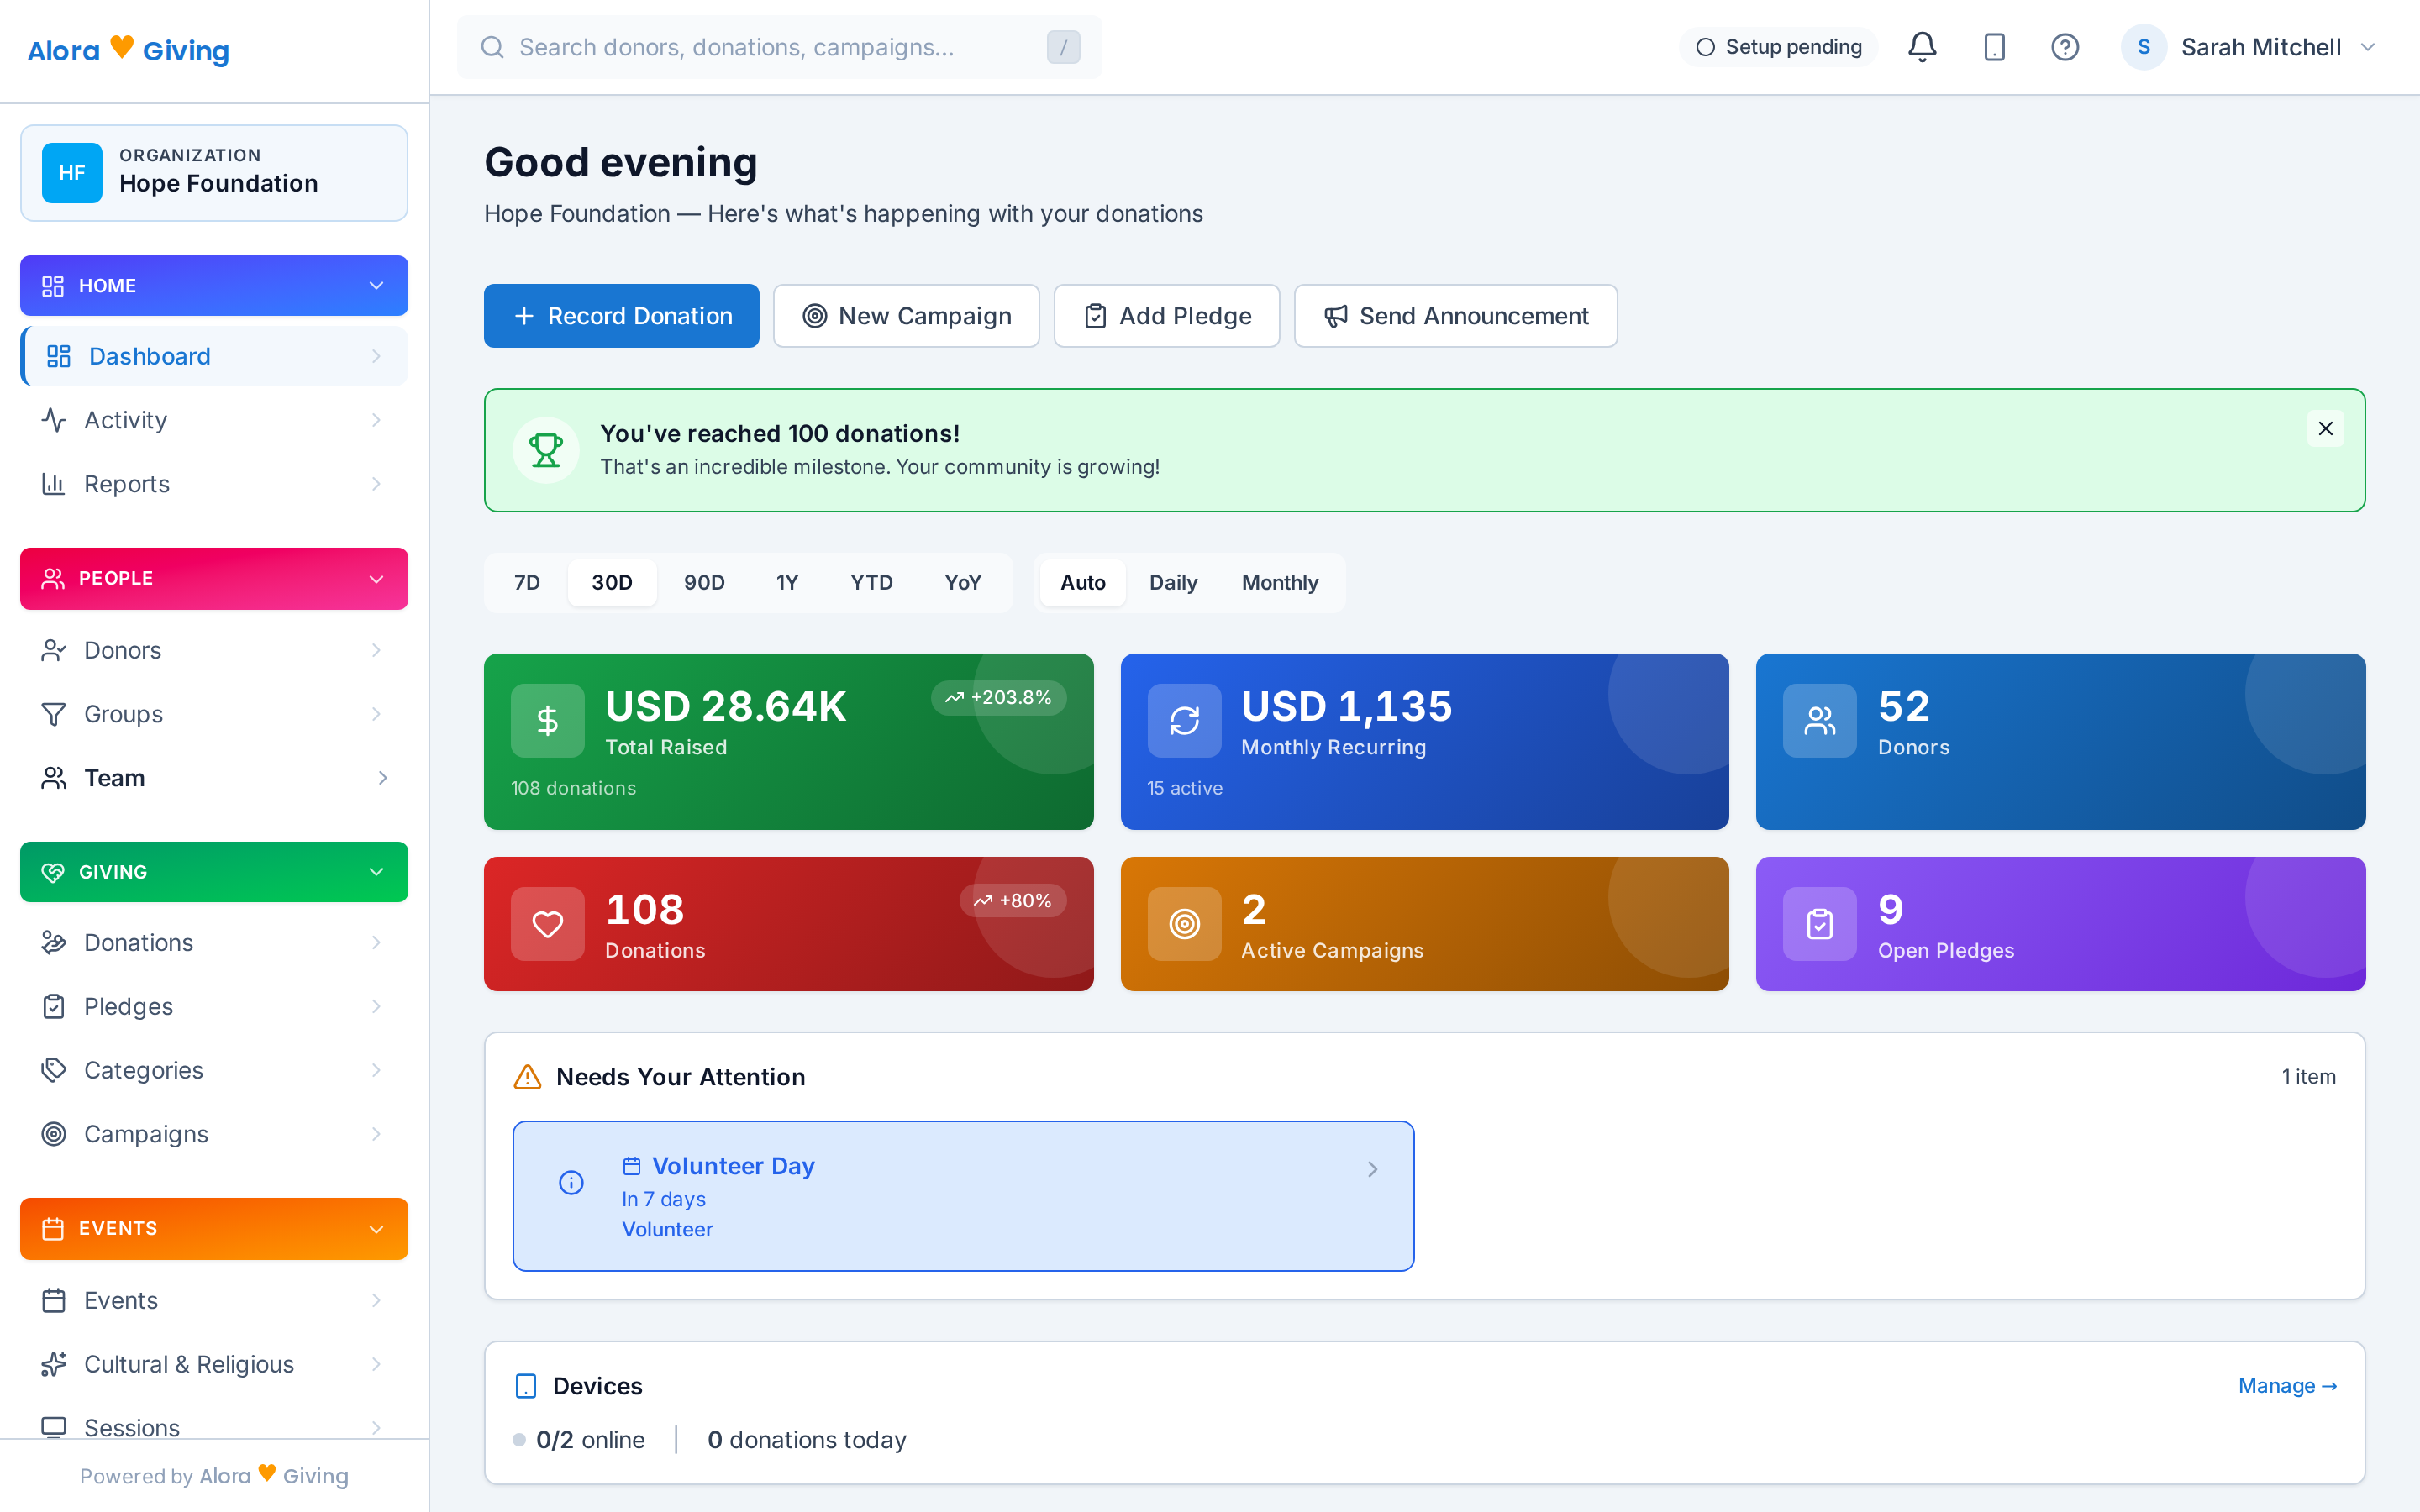
Needs-attention
A standing list of the things you'd otherwise find out too late: campaigns going quiet, failed recurring payments, overdue pledges, donors slipping toward lapse. Each item links straight to the record and the suggested next action.
📬
Daily admin digest
Not a dashboard you have to decode. A 3-5 sentence email every morning: yesterday's total, new supporters, campaign progress, anything needing attention. Written in your language, using your vocabulary.
🎯
Donor-lifecycle dashboards
Donors are automatically classified — new, active, lapsed, high-value — based on giving history, recency, and amount. Lifecycle dashboards show how donors flow between stages, and the stages drive both reporting and automation.
📊
Designation-level breakdown
See giving by program, project, fund, or cause — however your organization structures its work. NGOs see program-level aggregates with child project details. Churches see fund-level summaries.
🌐
Cross-org benchmarks Roadmap
Coming: privacy-preserving k-anonymity aggregates that show how your average gift and retention compare to similar orgs in your tradition — peer context without exposing individual donor data, yours or anyone else's.
📥
Export everything
Donations, donors, pledges, recurring subscriptions, campaign results — all exportable to CSV from any list view. Your data is yours; download whenever, no restrictions.
📋
Audit trail
Every change to every record — who, when, why — in a tamper-evident, hash-chained audit log verified every six hours. Discovery-ready if a regulator asks. Filterable by user, date range, entity, or action.